
Streamlining Manufacturing Processes With Pareto Charts
Streamlining Manufacturing Processes With Pareto Charts
In the fiercely competitive manufacturing industry, the primary key to staying in the lead is to streamline the manufacturing processes for better efficiency, quality, and cost reduction. One of the powerful tools gaining popularity in this mission is the Pareto chart. But what is a Pareto chart, and how does it help in improving the manufacturing processes? Keep reading to delve into the wonders of Pareto charts in manufacturing.
Understanding Pareto Charts
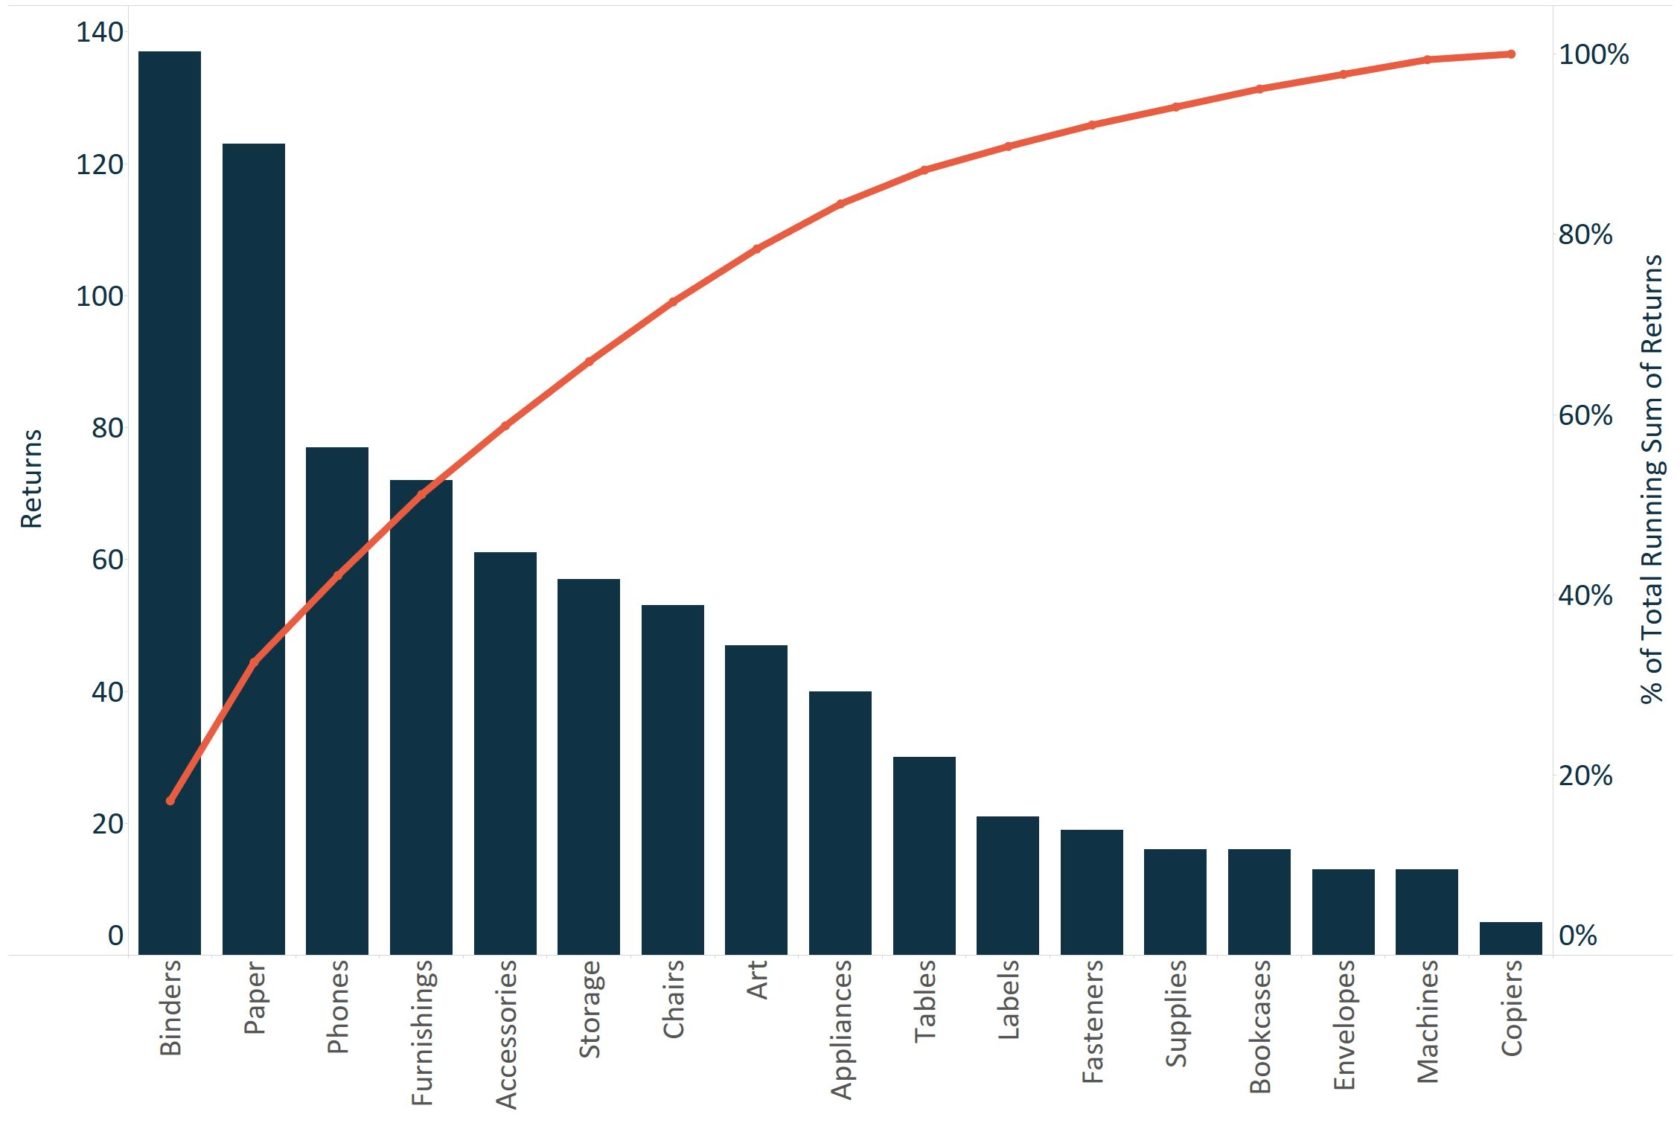
A Pareto chart is a statistical tool that graphically represents the causes of a particular problem in order of their significance. This chart is built on the Pareto principle, also known as the 80/20 rule, which suggests that approximately 80% of the problems arise from 20% of the causes.
The Pareto chart provides a visual representation of both categorical and numerical data, showing the most significant factors in a bar graph. These factors are organized in descending order of significance to focus on the major causes of problems. Using Pareto charts in the manufacturing industry is quite prevalent. It helps to identify and focus on the issues that need urgent attention and improvement. By exhibiting the problems in their order of significance, it allows for the efficient use of resources.
Role of Pareto Charts in Identifying Problem Areas
In the complexity of the manufacturing process, pinpointing the exact problem areas for improvement can be an overwhelming task. Here, Pareto charts come into play.
Pareto charts classify the causes of problems and rank them in order of their contribution to the total problem. This ranking makes it relatively easier for the manufacturing management to identify and address the most significant causes first.
Be it downtime, product defects, or supply chain disruptions, Pareto charts are useful in identifying and prioritizing the most critical issues affecting the manufacturing process. Thus, Pareto charts play an instrumental role in driving continuous improvement by directing efforts to the right areas in the manufacturing process.
How Pareto Charts Improve Process Efficiency

The Pareto chart, with its visual structure and clear presentation of information, facilitates the identification of issues that have a compound effect on the overall efficiency of a process.
By focusing efforts on resolving these key issues, process efficiency can be improved significantly. This improvement can range from reduced process defects and enhanced product quality to improved delivery times and overall operational efficiency.
The Pareto chart aids in ensuring that priority is given to the problems that hinder process efficiency the most. This targeted strategy helps to maximize the return on resources used in the problem-solving process.
In essence, Pareto charts are vital tools that support the data-informed decision-making process by providing clear, actionable insights for process improvement.
Real-world Case Studies of Pareto Charts in Manufacturing
To better understand the application of Pareto charts in manufacturing, let’s consider some real-world case studies. These case studies illustrate how businesses have used Pareto charts to improve their processes and outcomes.
In the automobile industry, for instance, a leading manufacturer used Pareto charts to identify the major causes of defects in their products. They were then able to focus their efforts on the most significant issues, resulting in a marked improvement in the quality of their products.
Another example involves a textile manufacturer who used Pareto charts to identify and address the root causes of machine downtime. This approach led to an increase in machine productivity and, consequently, a surge in overall operational efficiency.
Overall, Pareto charts serve as highly effective data visualization tools for streamlining manufacturing processes. Despite some limitations, their ability to enable targeted improvements based on the most significant problem areas makes them indispensable in manufacturing management. As the real-world examples demonstrate, manufacturing firms stand to gain much from the proper utilization of Pareto charts.